基于bootstrap的UI框架有:1、AdminLTE框架;2、ACE框架;3、clearmin框架;4、h-ui框架;5、Echats框架等等。

推荐:《bootstrap教程》
浅谈当前基于bootstrap框架的几种主流前端框架
一 概述
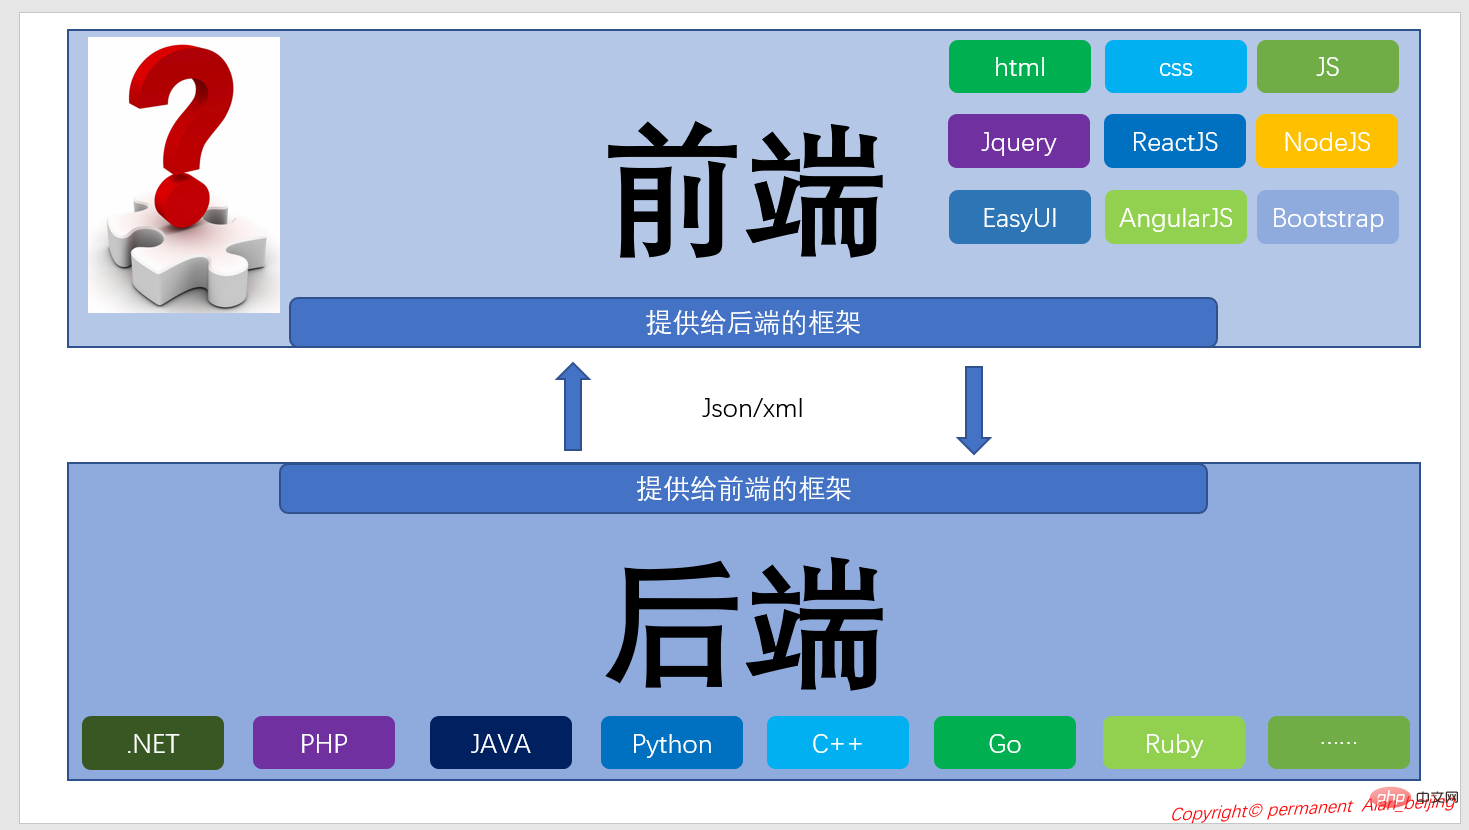
当新开发一个项目或产品时,技术选型是一个不可缺少的环节,在软件架构中有着举足轻重的作用,可以这么说,技术选型的好坏直接影响项目或产品的成败优劣,因此,在进行软件架构时,一定要想好技术选型。传统的前后端耦合在一起的模式,基本上不能满足当前环境下的大数据,高并发等需求,如.NET 的WebForm模式逐渐被MVC取代,MVC逐渐取代WebForm,其中有两点重要的原因:MVC前后端彻底分离和MVC通用性比较好。从架构的架构,我们把软件架构抽象为两部分,即前端和后端,两者通过接口来传递数据。但在本篇文章中,不谈架构,只是与大家分享几种基于Bootsrap的比较主流的前端框架。
当前几种比较流行的前端框架
(一)AdminLTE
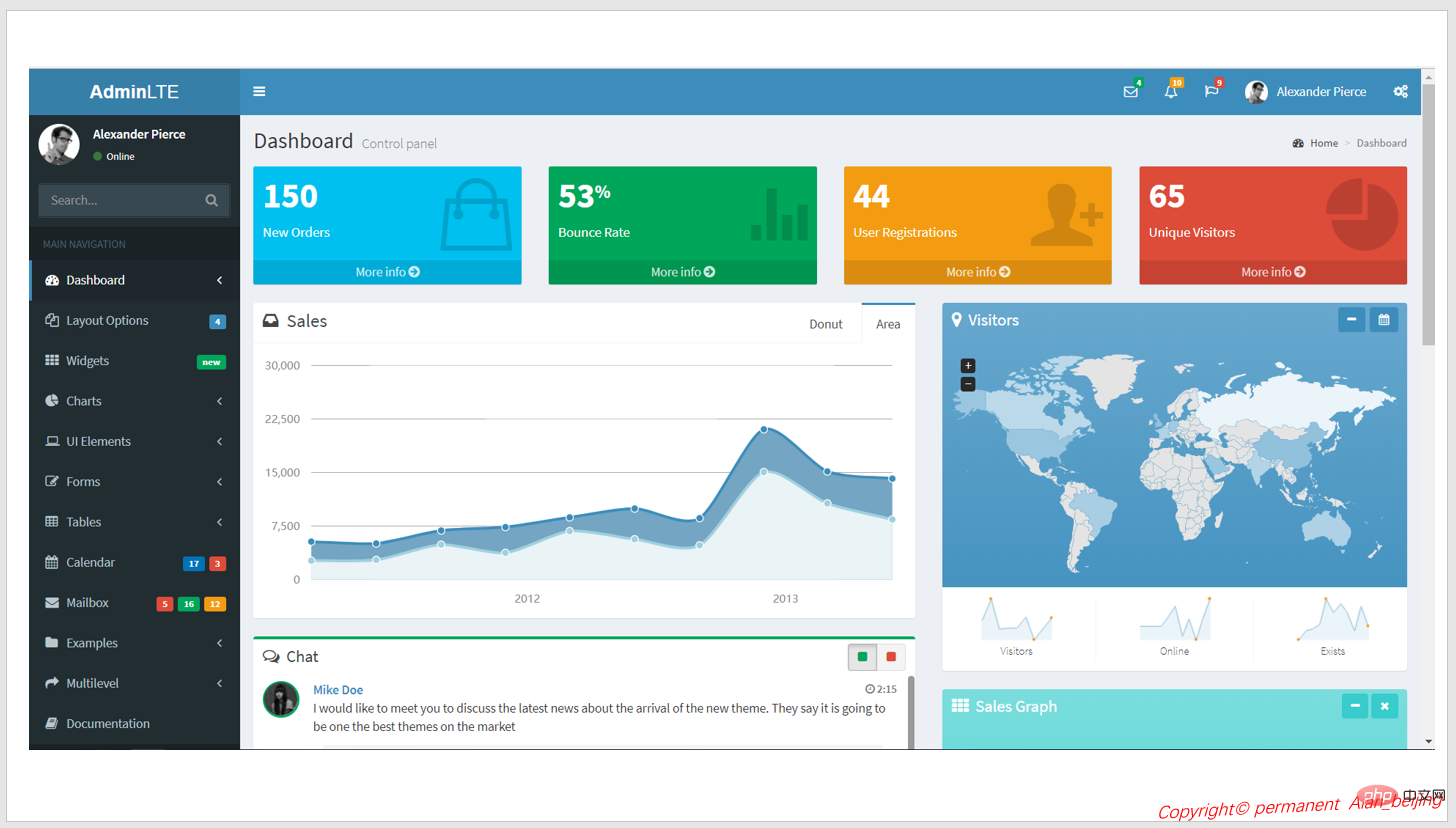
1.参考网址:https://adminlte.io/
2.开源
3.Bootstrap3框架
4.轻量级
5.完全响应式,支持定制化
6.github:https://github.com/almasaeed2010/AdminLTE
(二)ACE框架
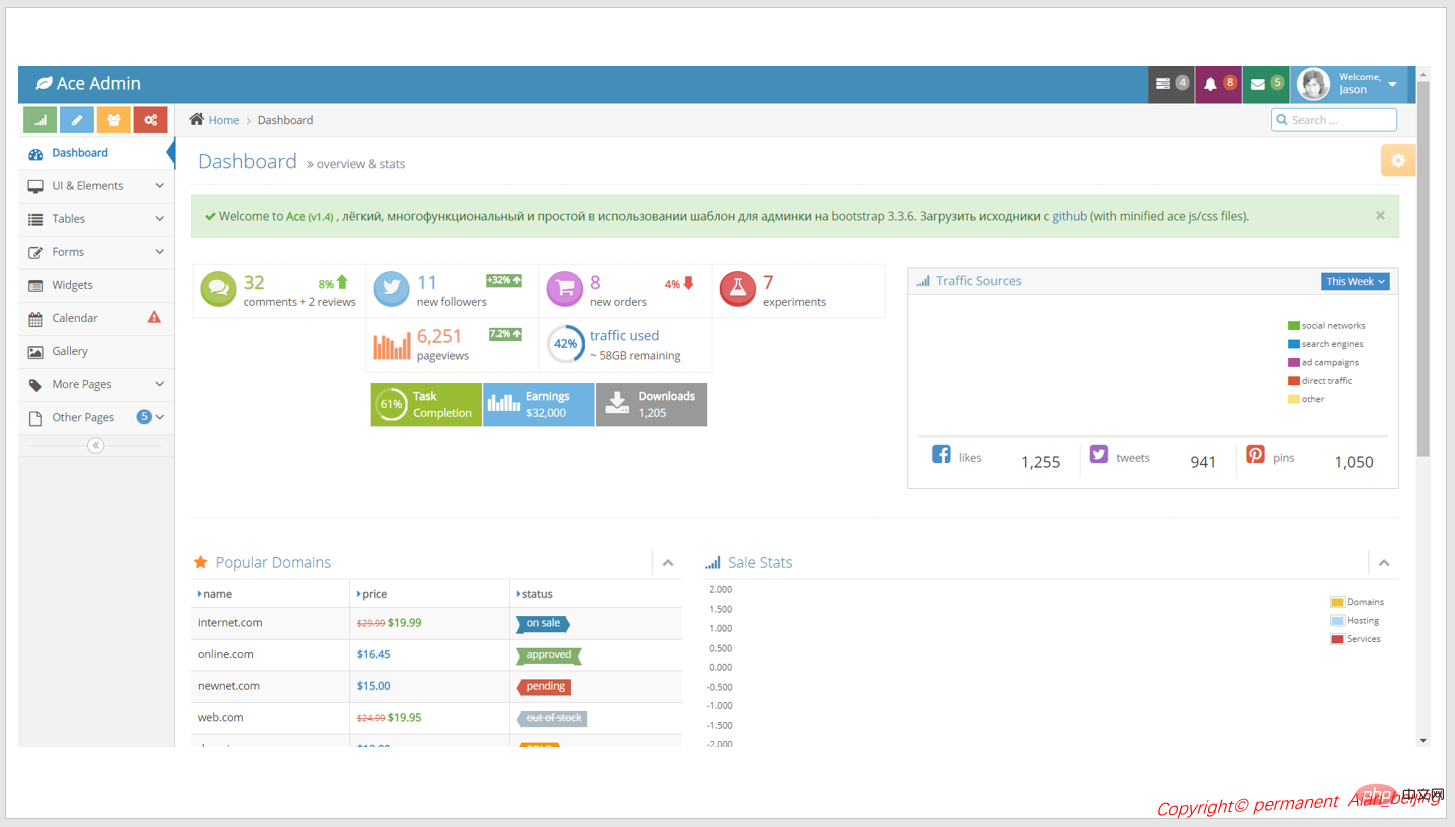
1.参考网址:http://ace.jeka.by/
2.Twitter bootstrap3开发的后台模板
3.开源
4.github:https://github.com/bopoda/ace
(三)clearmin
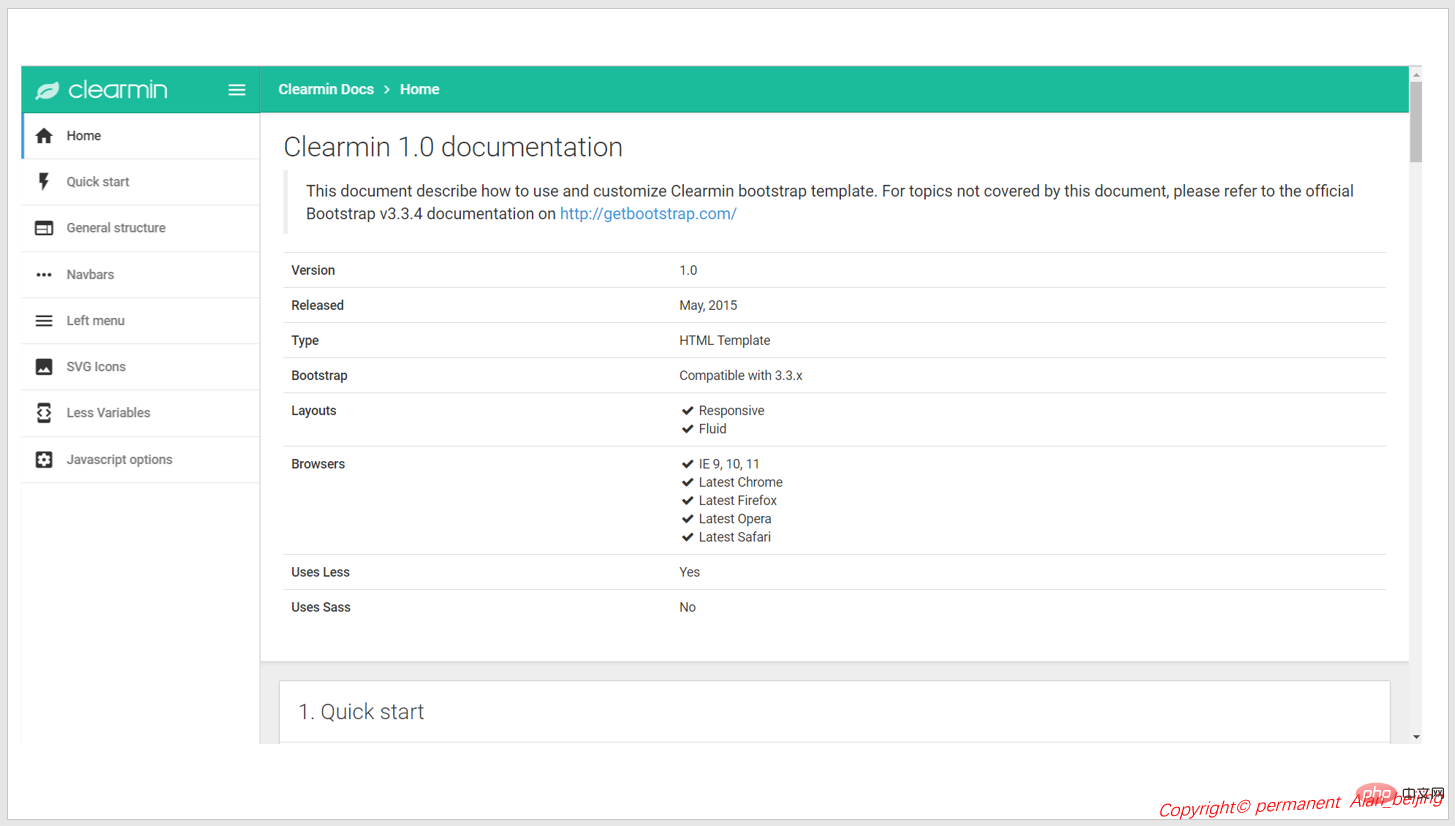
1.参考网址:http://cm.paomedia.com/
2.基于Bootstrap3框架开发的
3.github:https://github.com/paomedia/clearmin
(四)h-ui
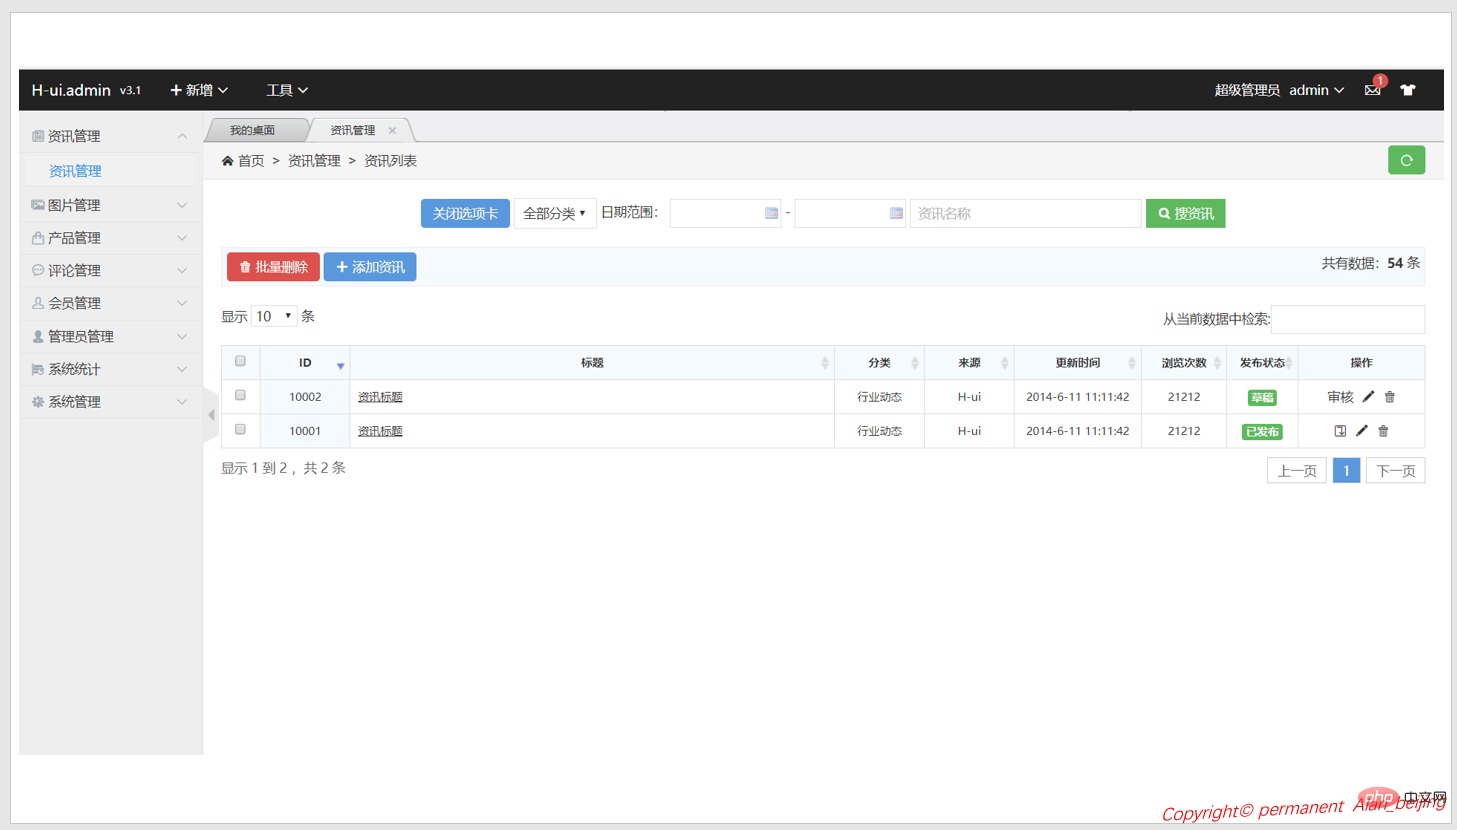
1.参考网址:http://www.h-ui.net/H-ui.admin.shtml
2.H-ui.admin是用H-ui前端框架开发的轻量级网站后台模版采用源生html语言,完全免费,简单灵活,兼容性好让您快速搭建中小型网站后台
(五)Echats
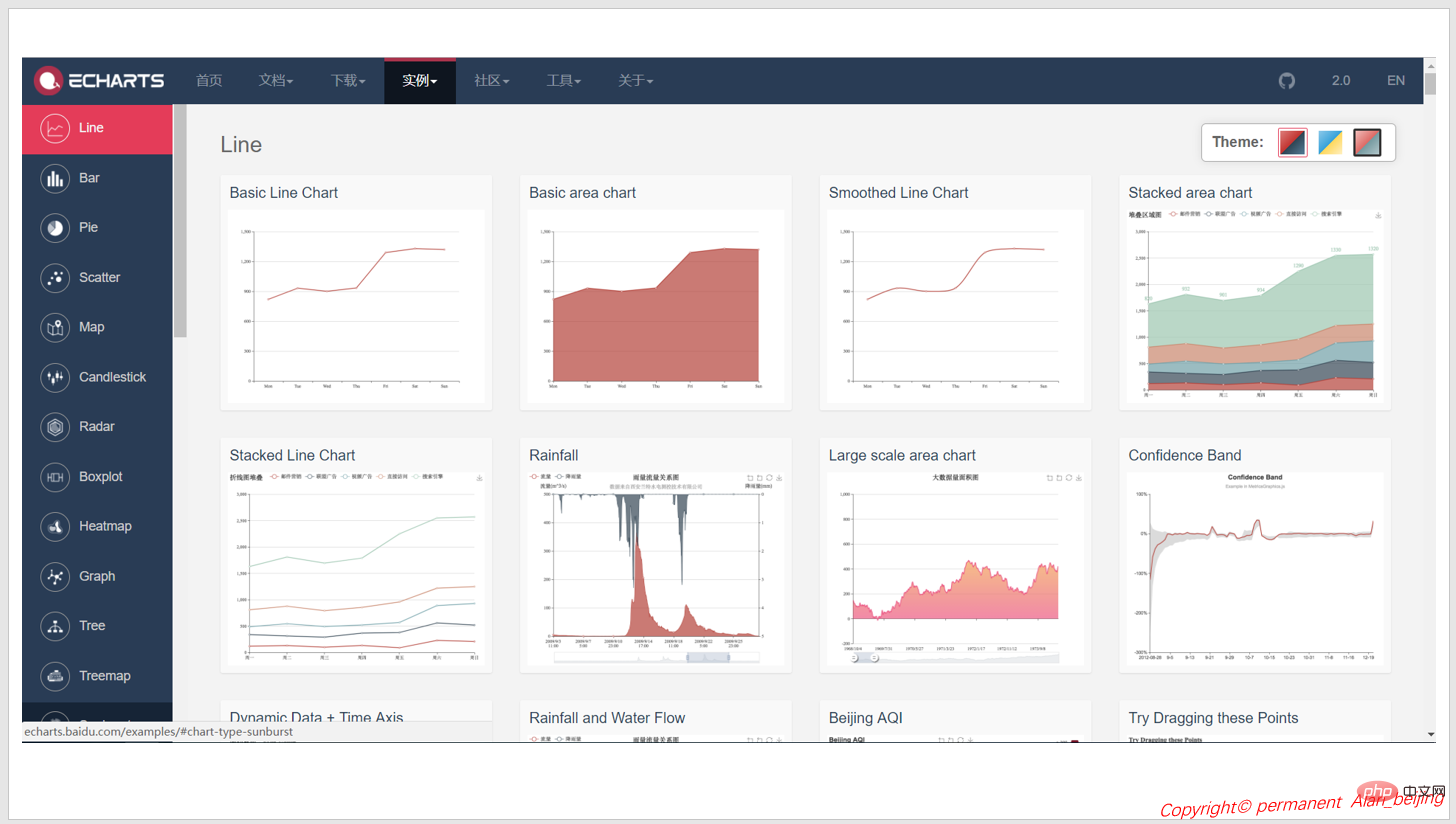
1.参考网址:http://echarts.baidu.com/
2.由百度团队开发,完全用js开发,功能强大,各种类型报表
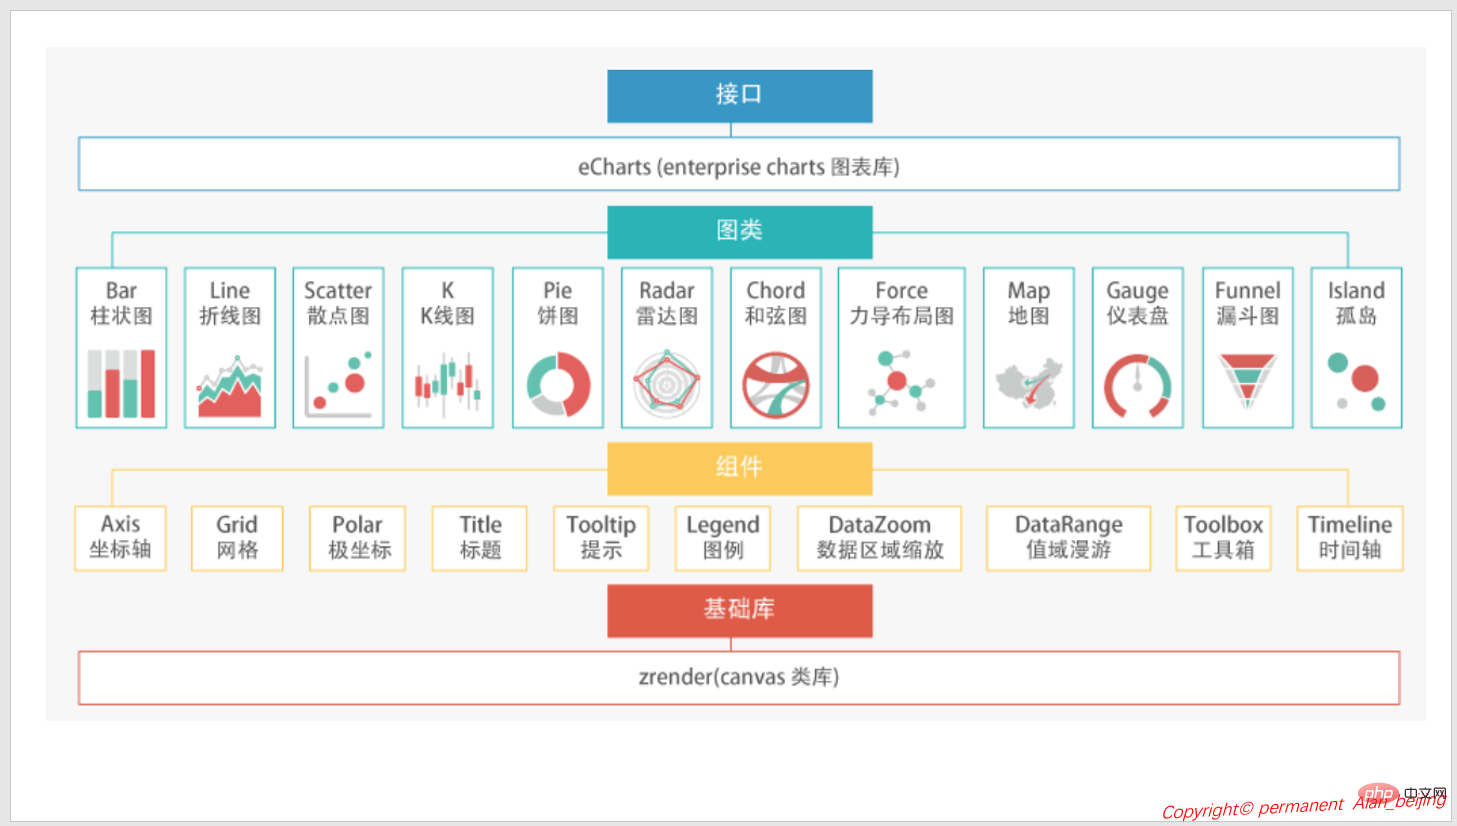
三 Echarts架构图
如上虽然给大家推荐了五套前端框架,但笔者推荐AdminLTE+H-ui+Echarts组合模式,这也是我目前在软件架构中运用到的组合模式。
Echarts框架
四 用Echarts做个报表统计
(一)先看看DEMO效果图
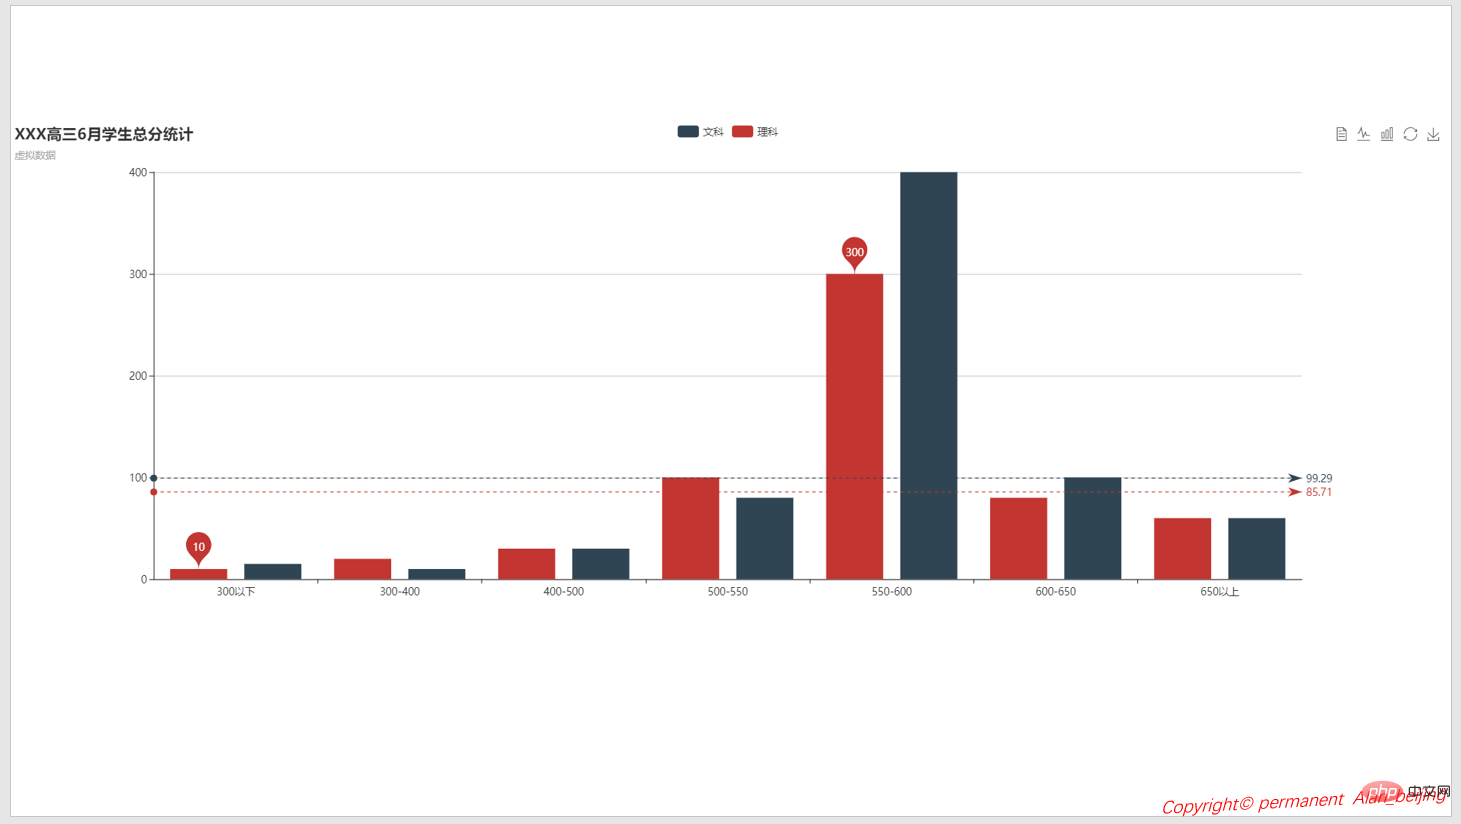
动态效果
1.支持多种动报表切换,如Line,Bar等;
2.具有隐藏/显示按钮;
3.具有数据表格功能;
4.具有图标保存功能。
(二) 前端Code
1.定义一个p容器
1 <p id="EchartsBarDemo" style="width:100%;height:600px"></p>
2.初始化
1 var myChart = echarts.init(document.getElementById('EchartsBarDemo'));
3.设置option
var option = { title: { text: 'XXX高三6月学生总分统计', subtext: '虚拟数据' }, tooltip: { trigger: 'axis' }, legend: { data: ['文科', '理科'] }, toolbox: { show: true, feature: { mark: { show: true }, dataView: { show: true, readOnly: false }, magicType: { show: true, type: ['line', 'bar'] }, restore: { show: true }, saveAsImage: { show: true } } }, calculable: true, xAxis: [ { type: 'category', data: ['300以下', '300-400', '400-500', '500-550', '550-600', '600-650', '650以上'] } ], yAxis: [ { type: 'value' } ], series: [ { name: '理科', type: 'bar', data: LiKeScores, markPoint: { data: [ { type: 'max', name: '最大值' }, { type: 'min', name: '最小值' } ] }, markLine: { data: [ { type: 'average', name: '平均值' } ] } }, { name: '文科', type: 'bar', data: WenKeScores, markPoint: {//标注点 data: [ { type: 'max', name: '最大值' }, { type: 'min', name: '最小值' } ] }, markLine: { //水平线 data: [ { type: 'average', name: '平均值' } //水平线表示平均值 ] } } ] }
4.将option添加给myCharts实例
myChart.setOption(option); // 设置加载等待隐藏 myChart.hideLoading();
(三).NET
public class DefaultController : Controller { // GET: Default public ActionResult BarEcharts() { return View(); } public ContentResult GetScoresJson() { //这里只是模拟数据,正式环境需要到db中查询 return Content("{LiKe:[10, 20, 30, 100, 300, 80, 60],WenKe:[15, 10, 30, 80, 400, 100, 60]}"); } }
(四)完整源码
1.前端
<html> <head> <meta name="viewport" content="width=device-width" /> <script src="~/Scripts/jquery-3.3.1.js"></script> <script src="~/Scripts/echarts.js"></script> <title>BarEcharts</title> </head> <body> <div id="EchartsBarDemo" style="width:100%;height:600px"></div> </body> </html> <script> //初始化 var myChart = echarts.init(document.getElementById('EchartsBarDemo')); //定义全局变量 //var LiKeScores = [10, 20, 30, 100, 300, 80, 60]; //var WenKeScores = [15, 10, 30, 80, 400, 100, 60]; var LiKeScores = []; var WenKeScores = []; var jsonURL = "/Default/GetScoresJson"; $.ajax({ type: 'get', url: jsonURL, dataType: "text", success: function (rspData) { console.log(rspData); var str = eval('(' + rspData + ')'); LiKeScores =str.LiKe; WenKeScores = str.WenKe; var option = { title: { text: 'XXX高三6月学生总分统计', subtext: '虚拟数据' }, tooltip: { trigger: 'axis' }, legend: { data: ['文科', '理科'] }, toolbox: { show: true, feature: { mark: { show: true }, dataView: { show: true, readOnly: false }, magicType: { show: true, type: ['line', 'bar'] }, restore: { show: true }, saveAsImage: { show: true } } }, calculable: true, xAxis: [ { type: 'category', data: ['300以下', '300-400', '400-500', '500-550', '550-600', '600-650', '650以上'] } ], yAxis: [ { type: 'value' } ], series: [ { name: '理科', type: 'bar', data: LiKeScores, markPoint: { data: [ { type: 'max', name: '最大值' }, { type: 'min', name: '最小值' } ] }, markLine: { data: [ { type: 'average', name: '平均值' } ] } }, { name: '文科', type: 'bar', data: WenKeScores, markPoint: {//标注点 data: [ { type: 'max', name: '最大值' }, { type: 'min', name: '最小值' } ] }, markLine: { //水平线 data: [ { type: 'average', name: '平均值' } //水平线表示平均值 ] } } ] } myChart.setOption(option); // 设置加载等待隐藏 myChart.hideLoading(); }, error: function (data) { console.log(data); LiKeScores = data.LiKe; WenKeScores = data.WenKe; //Loading(false); } }); </script>
2.后端
using System; using System.Collections.Generic; using System.Linq; using System.Web; using System.Web.Mvc; namespace EchartDemo.Controllers { public class DefaultController : Controller { // GET: Default public ActionResult BarEcharts() { return View(); } public ContentResult GetScoresJson() { //这里只是模拟数据,正式环境需要到db中查询 return Content("{LiKe:[10, 20, 30, 100, 300, 80, 60],WenKe:[15, 10, 30, 80, 400, 100, 60]}"); } } }
